Strategic deployment of LED video walls transforms concerts from simple performances into immersive multisensory experiences. Understanding sight lines, content strategies, and psychological impact enables productions to maximize audience engagement while ensuring every attendee, regardless of location, enjoys meaningful connection with the performance.
Viewing Angle Optimization
LED panel viewing angles typically span 140 degrees horizontally and 130 degrees vertically before brightness drops below 50%. Strategic positioning ensures maximum audience coverage within optimal viewing zones. Side screens angled 15-20 degrees toward center sections improve visibility for extreme side seating while maintaining image quality for central viewers.
Height calculations balance visibility over standing crowds against neck strain for seated sections. Main screens positioned 6-8 meters above stage level serve floor audiences while remaining comfortable for balcony viewing. A 10-meter tall screen visible from 100 meters requires bottom edge elevation of 4 meters to clear standing audiences averaging 1.8 meters height.
Multi-zone display strategies address diverse viewing positions throughout venues. Main screens serve central seating, side screens cover wing sections, and delay screens reach upper levels and obstructed positions. Each zone receives optimized content considering viewing distance and angle. This distributed approach ensures 95% of audiences maintain direct screen visibility.
Curved LED configurations expand optimal viewing zones compared to flat displays. A 10-degree curve on 30-meter wide screens increases side viewing quality by 25%. However, content must compensate for geometric distortion, requiring specialized rendering or real-time correction. Production costs increase 15-20% for curved configurations, justified by improved audience experience.
Content Design for Maximum Impact
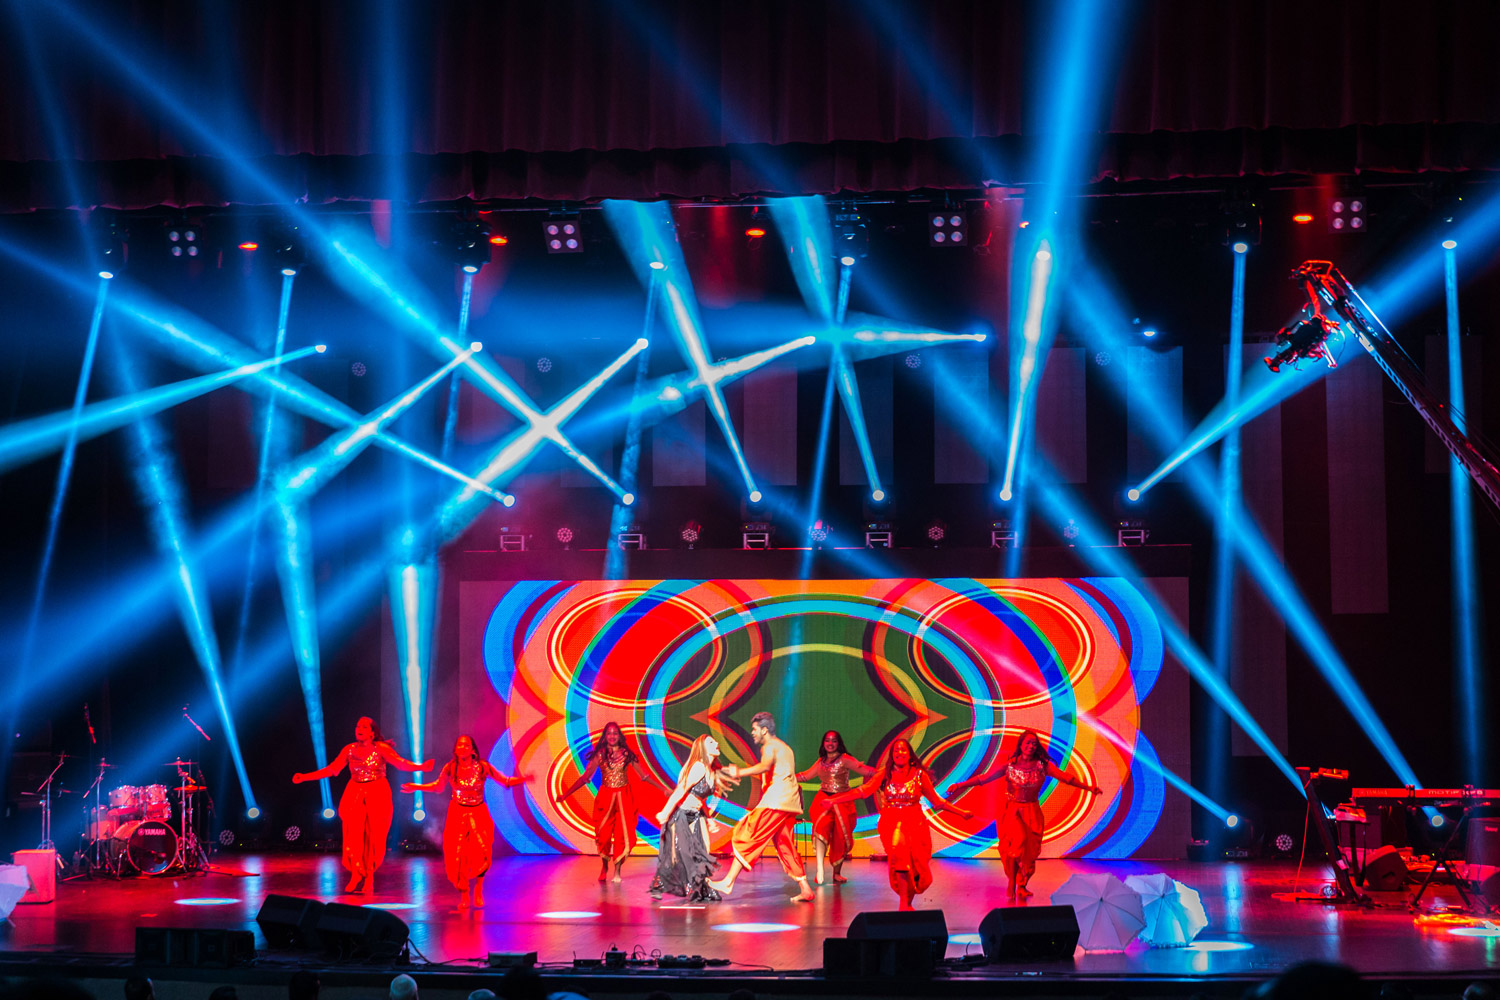
IMAG (image magnification) strategies vary based on venue scale and artist preference. Close-ups dominate arena shows where distant audiences cannot see performer expressions. Medium shots balance intimacy with context for mid-sized venues. Wide shots during instrumental sections provide breathing room preventing visual fatigue from constant close-ups.
Camera positioning influences emotional connection between performers and audiences. Low angles create heroic perspectives empowering performers. Eye-level positions establish intimate connections. High angles provide overview context during complex staging. Professional productions employ 6-8 cameras enabling diverse perspectives throughout performances.
Motion graphics complement without overwhelming musical performances. Abstract visualizations responding to audio frequencies create synaesthetic experiences. Particle effects and geometric patterns provide energy during instrumental sections. Narrative content requires careful synchronization avoiding distraction from live performance elements.
Color psychology influences audience emotional response. Warm colors (reds, oranges) increase energy and excitement. Cool colors (blues, greens) create calm, introspective moods. Rapid color changes stimulate attention while gradual transitions maintain flow. Content creators balance these elements supporting musical dynamics.
Accessibility Considerations
Sign language interpretation displays on dedicated screen sections ensure deaf audience members enjoy full show experience. Picture-in-picture overlays position interpreters consistently throughout performances. Brightness and contrast optimization ensures visibility against varying backgrounds. Some productions dedicate entire side screens to accessibility services.
Visual description services for blind attendees synchronize with video content. Audio descriptions transmitted through assisted listening devices narrate visual elements. Timing avoids overlapping with musical performance or dialogue. Professional describers familiar with music terminology provide relevant context.
Photosensitive epilepsy considerations limit strobing effects and rapid transitions. Flashing content below 3Hz or above 60Hz reduces seizure risk. Brightness transitions spread over multiple frames prevent sudden changes. Warning notices before shows alert sensitive individuals to potential triggers.
Subtitle displays for lyrics and announcements serve hearing-impaired and non-native speakers. Real-time captioning requires skilled operators transcribing at 200+ words per minute. Pre-programmed lyrics synchronize with backing tracks ensuring accuracy. Font selection and sizing maintain readability from maximum distances.
Crowd Psychology and Engagement
Synchronized visual moments create shared experiences bonding audiences together. Coordinated color washes during choruses unite crowds in common emotional states. Countdown timers build anticipation for encore returns. Audience cam displays showing dancing fans encourage participation.
Interactive elements transform passive viewing into active participation. Mobile phone integration displays audience messages or photos. QR codes trigger augmented reality experiences. Motion sensors respond to crowd movement affecting visual content. These technologies require robust infrastructure handling thousands of simultaneous connections.
Pacing strategies maintain engagement throughout 90-120 minute performances. High-energy visuals open shows capturing attention. Quieter moments provide recovery preventing sensory overload. Climactic sequences build toward encore presentations. Visual intermissions during set changes maintain atmosphere.
Social media integration extends experience beyond venue walls. Hashtag campaigns aggregate fan content for display. Live streaming cameras capture audience energy for broadcast. Post-show content continues engagement driving merchandise and future ticket sales.
Venue-Specific Adaptations
Stadium configurations require massive displays visible from 200+ meter distances. Multiple delay towers throughout field areas ensure complete coverage. Broadcast-quality infrastructure supports television and streaming distribution. Weather contingencies protect equipment while maintaining show quality.
Theater settings demand subtle integration preserving architectural aesthetics. Retractable screens deploy only when needed. Projection mapping incorporates venue features. Lower brightness settings respect intimate atmosphere. Content design considers shorter viewing distances and refined audience expectations.
Festival environments accommodate transient audiences and varying attention spans. Bold graphics compete with environmental distractions. Sponsor integration generates additional revenue. Schedule displays and artist information provide practical value. Robust construction withstands weather and crowd pressure.
Club venues maximize impact within spatial constraints. LED panels double as architectural elements. Floor and ceiling integration creates immersive environments. Modular configurations adapt to different event types. Beer-proof coatings protect against liquid damage.
Performance Metrics and Analysis
Heat mapping tracks audience attention identifying highly engaged screen regions. Eye-tracking studies reveal viewing patterns optimizing content placement. Engagement drops 40% when screens display static content exceeding 30 seconds. Optimal shot duration ranges from 3-7 seconds maintaining visual interest.
Audience surveys measure satisfaction with visual elements. 85% of concert-goers report LED screens significantly enhance experience. Screen visibility ranks second only to sound quality in satisfaction factors. Willingness to pay premium prices increases 30% for enhanced production values.
Social media sentiment analysis evaluates visual impact. Posts mentioning visual elements generate 3x more engagement. Video clips featuring LED content receive 5x more shares. Negative comments typically focus on brightness discomfort or content repetition.
Physiological measurements including heart rate and skin conductance indicate emotional arousal. Synchronized visual peaks correlate with 15-20% increase in physiological response. Extended high-intensity sequences produce adaptation reducing impact. Variety in visual stimulation maintains elevated engagement.
Economic Impact on Ticket Sales
Premium seating zones with optimal screen viewing command 25-40% higher prices. VIP packages emphasizing visual experience sell at 3-5x standard prices. Dynamic pricing adjusts based on screen proximity and viewing quality. Revenue optimization models balance capacity with price premiums.
Production value perception influences future purchase decisions. Audiences experiencing high-quality LED productions show 45% higher repeat attendance. Word-of-mouth recommendations increase 60% for visually impressive shows. Social media content extends marketing reach exponentially.
Sponsor visibility on LED screens justifies increased investment. Brand impressions during concerts reach millions through attendance and social sharing. Dynamic advertising rotation generates $10,000-50,000 per show. Product integration within custom content creates additional revenue streams.
Merchandise sales increase 20-30% when LED screens display product information. QR codes linking to online stores capture impulse purchases. Limited edition visuals drive exclusive merchandise demand. Post-show email campaigns featuring concert visuals maintain engagement.
Optimizing audience experience through strategic LED deployment creates lasting memories transcending simple musical performance. Investment in quality visual production generates measurable returns through increased satisfaction, social engagement, and revenue generation. As audience expectations continue rising, LED video walls evolve from production enhancements to essential elements defining modern concert experiences.